Visitors, office crowds and apps keep dining demand high
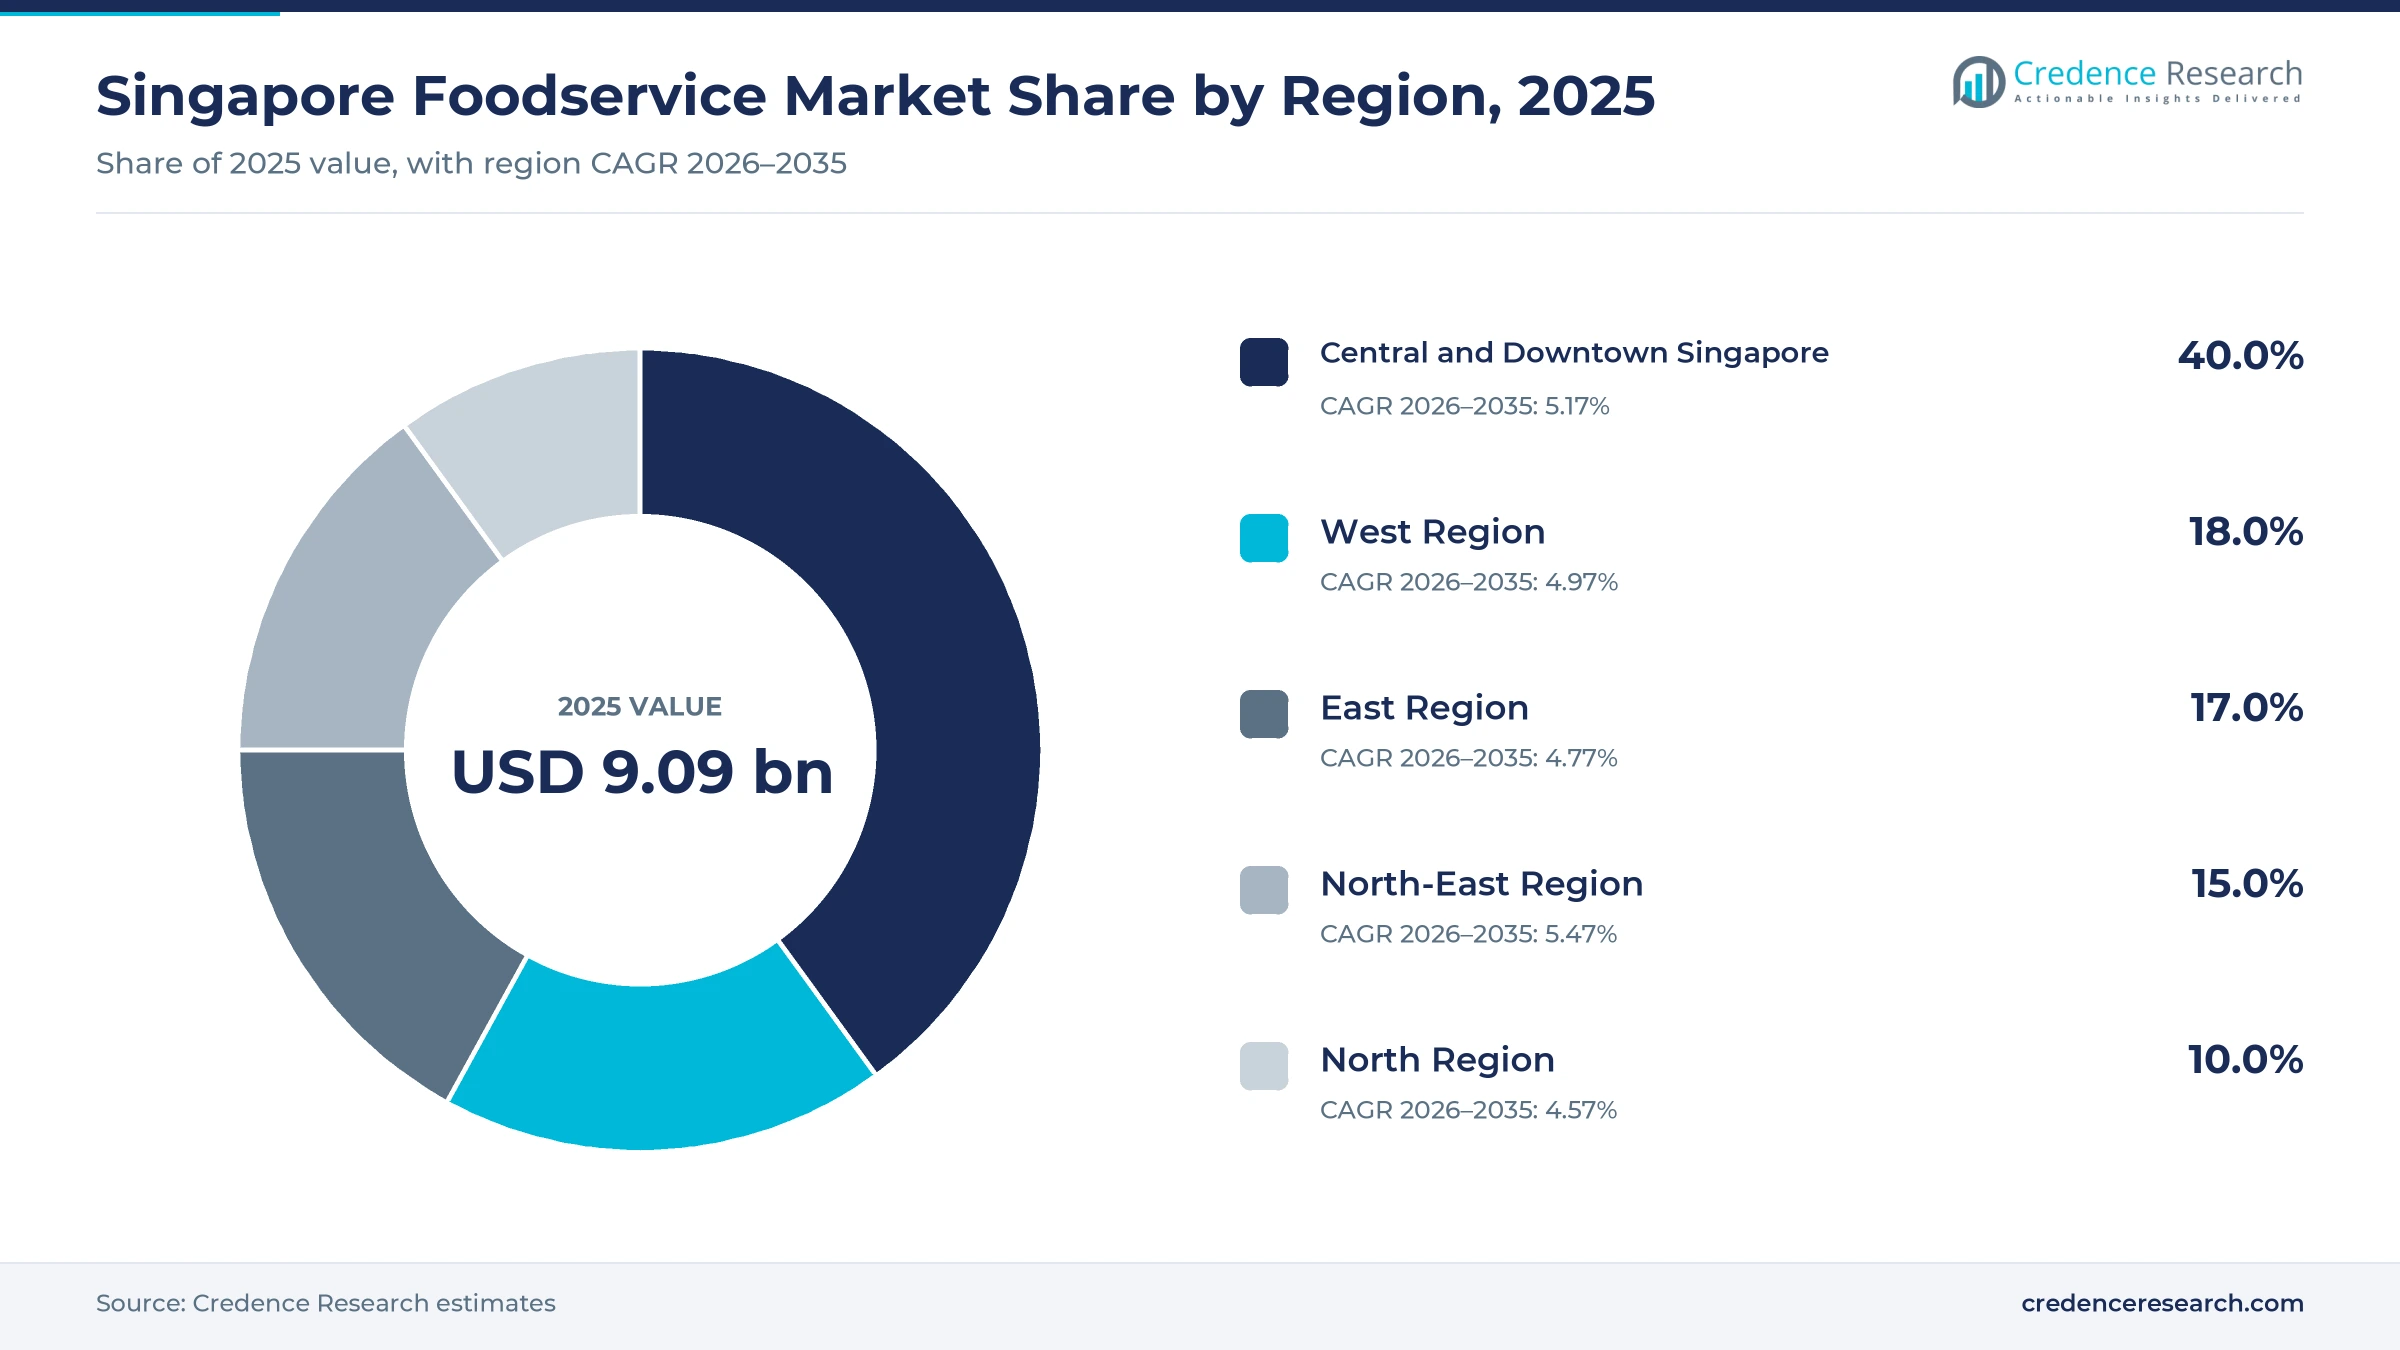
The Singapore foodservice market was valued at USD 9.09 billion in 2025 and is projected to increase from USD 9.53 billion in 2026 to USD 14.85 billion by 2035, registering a CAGR of 5.05% during 2026–2035. Demand comes from residents who eat out several times a week at hawker centers, food courts and restaurants, from office workers who buy lunch near work and from visitors who spend heavily on dining. Central and Downtown Singapore held the largest regional share, 40.0% in 2025, because the business district, Orchard Road and Marina Bay draw both office crowds and tourists. The North-East Region is the fastest-growing zone at 5.47% a year, as new homes, campuses and the Punggol Digital District add diners. In turn, the Singapore Tourism Board reported that food and beverage tourism receipts rose 15% in the first nine months of 2025, the strongest growth among spending categories.
Which outlets and meal occasions does the estimate cover?
The estimate measures the consumer and institutional value of meals, snacks and drinks served by full-service restaurants, limited-service restaurants, cafes, food courts, hawker stalls and caterers in Singapore. It covers dine-in, takeaway, platform delivery, direct delivery and contract service for offices, schools and events, whether outlets are company-owned, franchised or run under concession.
The estimate excludes packaged food sold through supermarkets, alcohol sold for home use and meals served inside private homes by households. The value chain runs from food importers, central kitchens and equipment suppliers through operators, landlords and delivery platforms to residents, workers, students and visitors.
Singapore Foodservice Market Insights
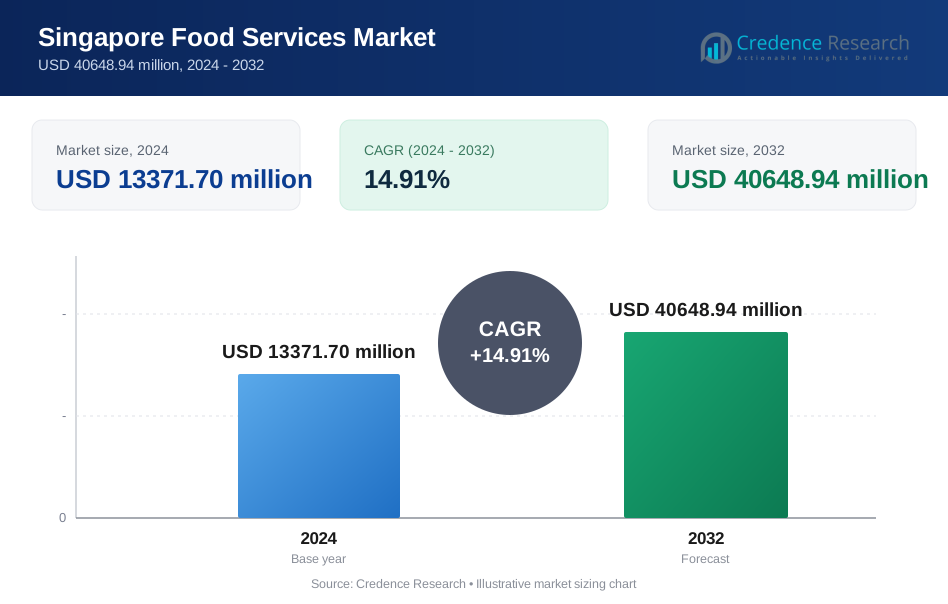
- The Singapore foodservice market was valued at USD 9.09 billion in 2025 and is projected to reach USD 14.85 billion by 2035, registering a CAGR of 5.05% during 2026–2035.
- Central and Downtown Singapore held a 40.0% share of 2025 value, because the business district and Marina Bay draw office crowds and visitors.
- Full-service restaurants led with a 34.0% share of 2025 value, because celebrations, business meals and visitor dining carry higher bills per diner.
- Singapore welcomed 16.9 million international visitors in 2025, up 2.3%, and expects 17 million to 18 million visitors in 2026.
- The Government accepted new Food Services Progressive Wage Model increases on March 16, 2026, lifting the entry wage to $2,500 by July 2028.
Full-service dining leads while cafes grow fastest
Why do full-service restaurants hold the largest value?
Based on service type, the market is categorized into full-service restaurants, limited-service restaurants, cafes and beverage outlets, food courts and hawker services, and catering services. Full-Service Restaurants led with a 34.0% share of 2025 value, because family celebrations, business meals and visitor dining carry higher bills. Cafes and Beverage Outlets grow fastest at 5.87% a year, as specialty coffee, tea and dessert chains open in malls and offices.
Which diners spend the most across the city?
Based on customer type, the market is categorized into resident households, office workers, students, tourists and institutional buyers. Resident Households led with a 46.0% share of 2025 value, because most residents eat out several times a week for breakfast, dinner and weekend meals. Tourists grow fastest at 6.14% a year, as concerts, sports events and new attractions bring more visitors who spend on dining.
How are delivery models changing meal purchases?
Based on delivery model, the market is categorized into dine-in, takeaway, platform delivery, direct delivery and contract and on-site service. Dine-In led with a 55.0% share of 2025 value, because hawker centers, food courts and restaurants remain social places to eat. Direct Delivery grows fastest at 6.90% a year, as chains push their own apps and loyalty programs to cut commission costs.
Why do mall-based outlets lead outlet formats?
Based on outlet format, the market is categorized into standalone outlets, mall-based outlets, hawker and food court stalls, hotel and attraction venues, and cloud kitchens. Mall-Based Outlets led with a 38.0% share of 2025 value, because malls sit above train stations and draw steady crowds. Cloud Kitchens grow fastest at 6.59% a year, as delivery brands run several menus from one shared kitchen.
| Segment Group | Leading Sub-segment | Share, 2025 | Fastest-growing Sub-segment | CAGR, 2026–2035 |
|---|---|---|---|---|
| By Service Type | Full-Service Restaurants | 34.0% | Cafes and Beverage Outlets | 5.87% |
| By Customer Type | Resident Households | 46.0% | Tourists | 6.14% |
| By Delivery Model | Dine-In | 55.0% | Direct Delivery | 6.90% |
| By Outlet Format | Mall-Based Outlets | 38.0% | Cloud Kitchens | 6.59% |
Request a Free Sample
Fill in your details and we'll send you a free sample report.
- Sample data tables & charts
- Research methodology
Visitors, daily meals and digital tools lift dining sales
How does visitor spending lift restaurant and cafe sales?
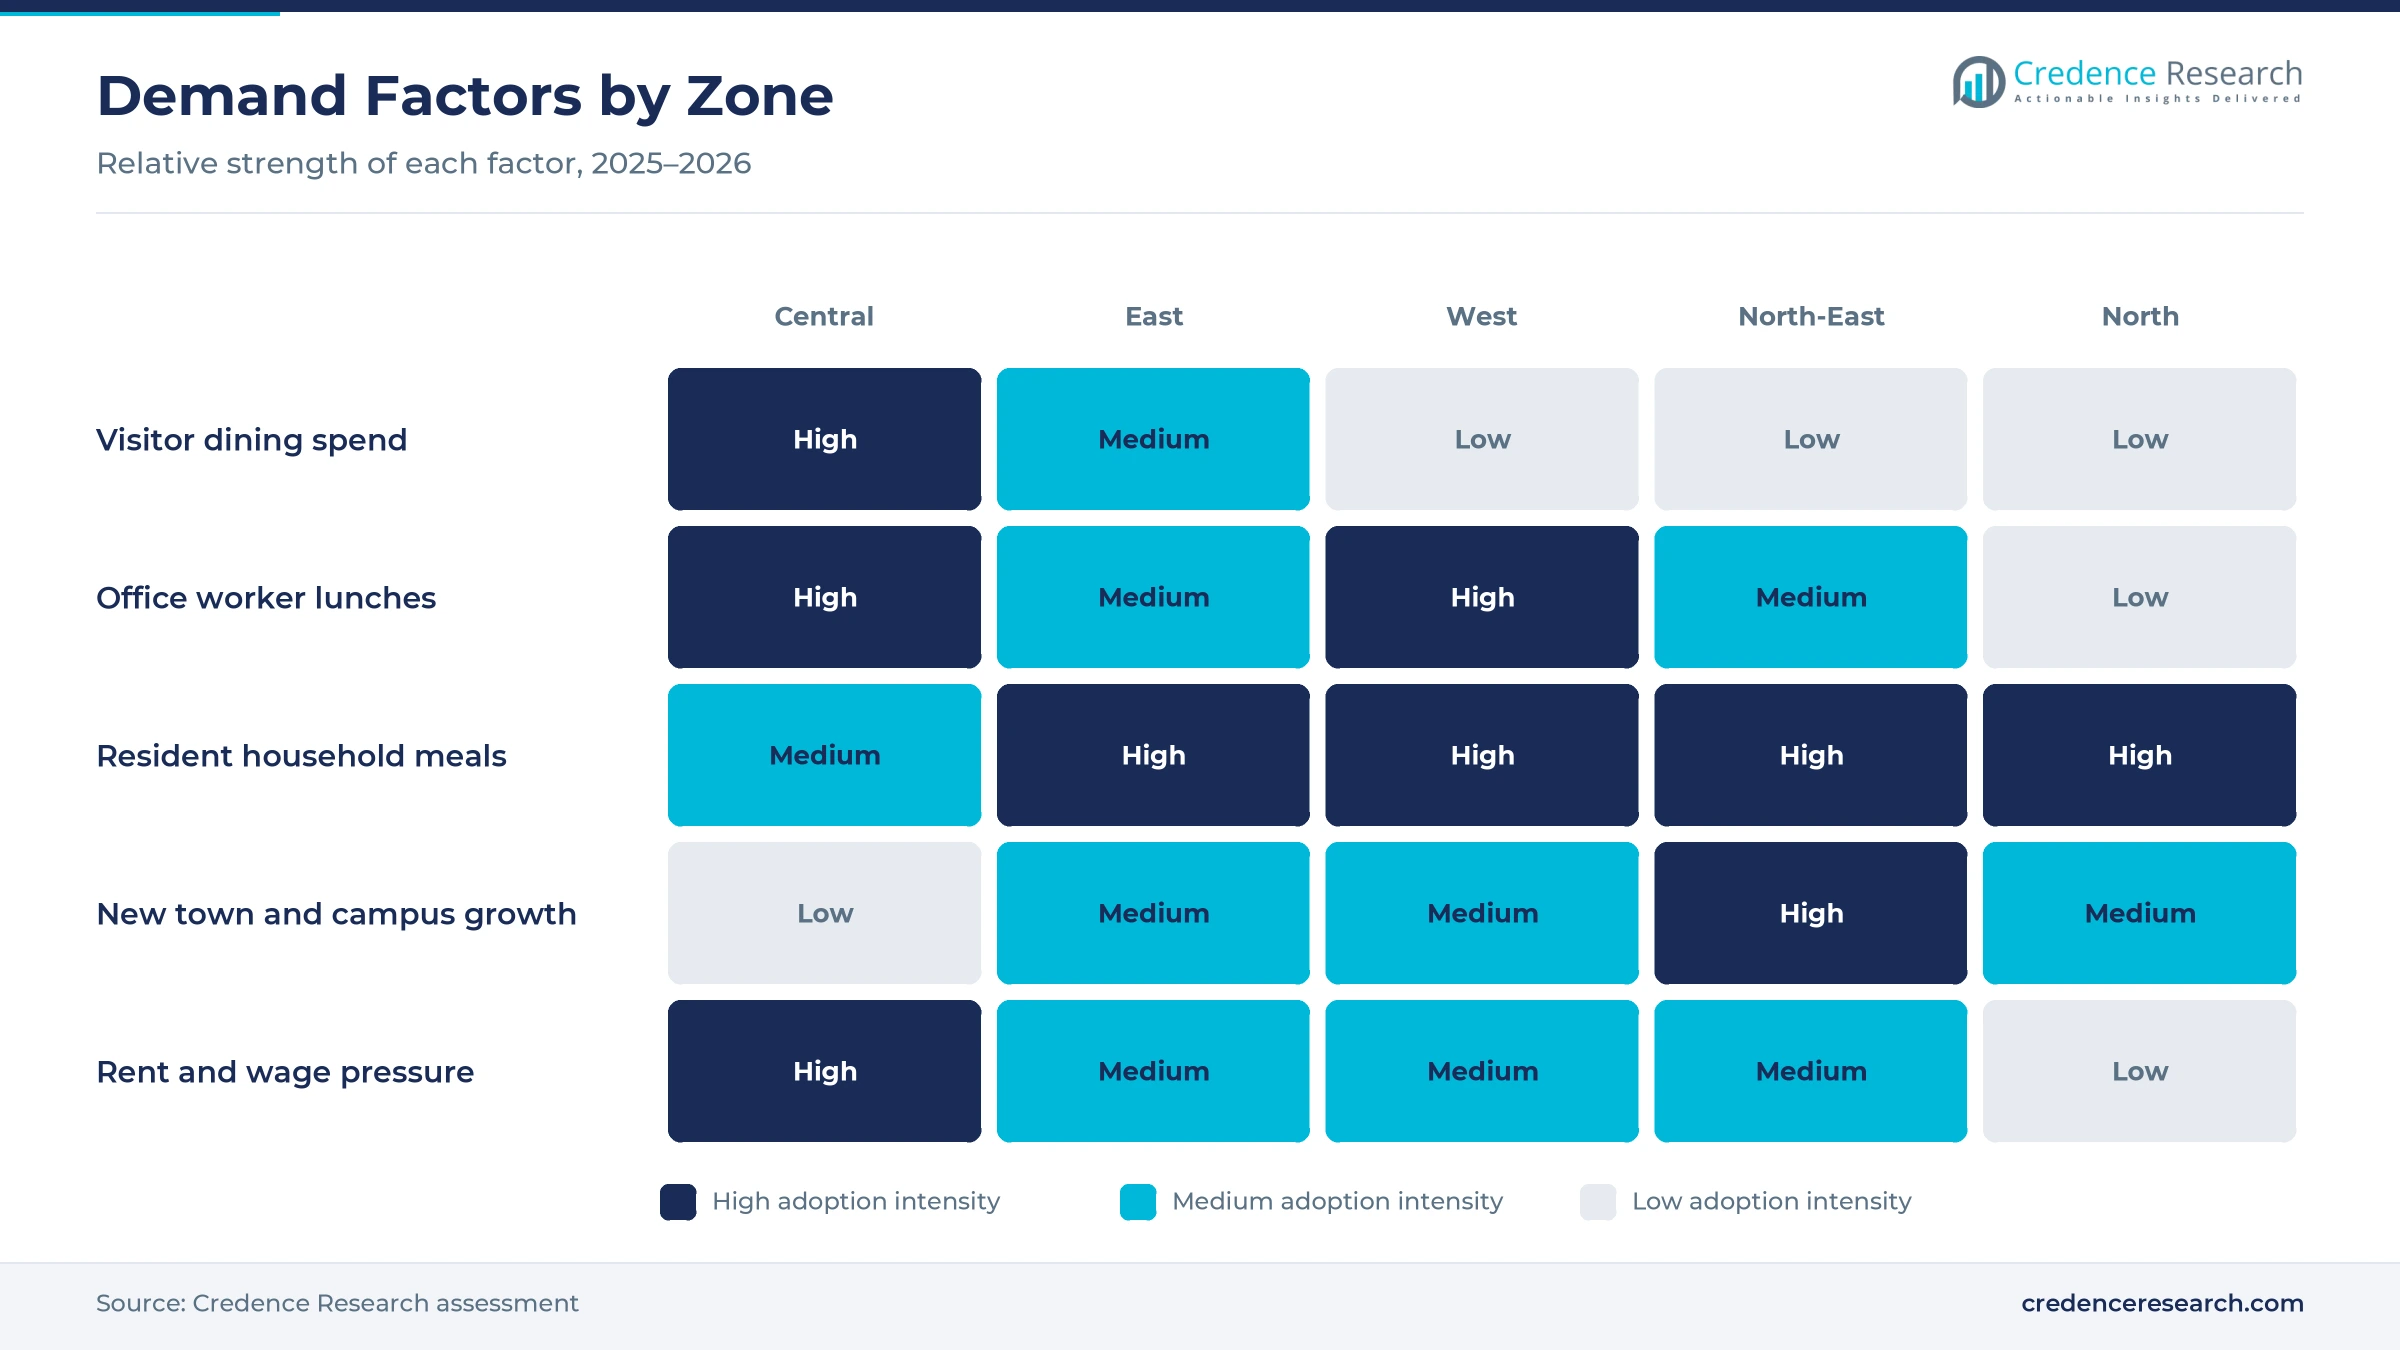
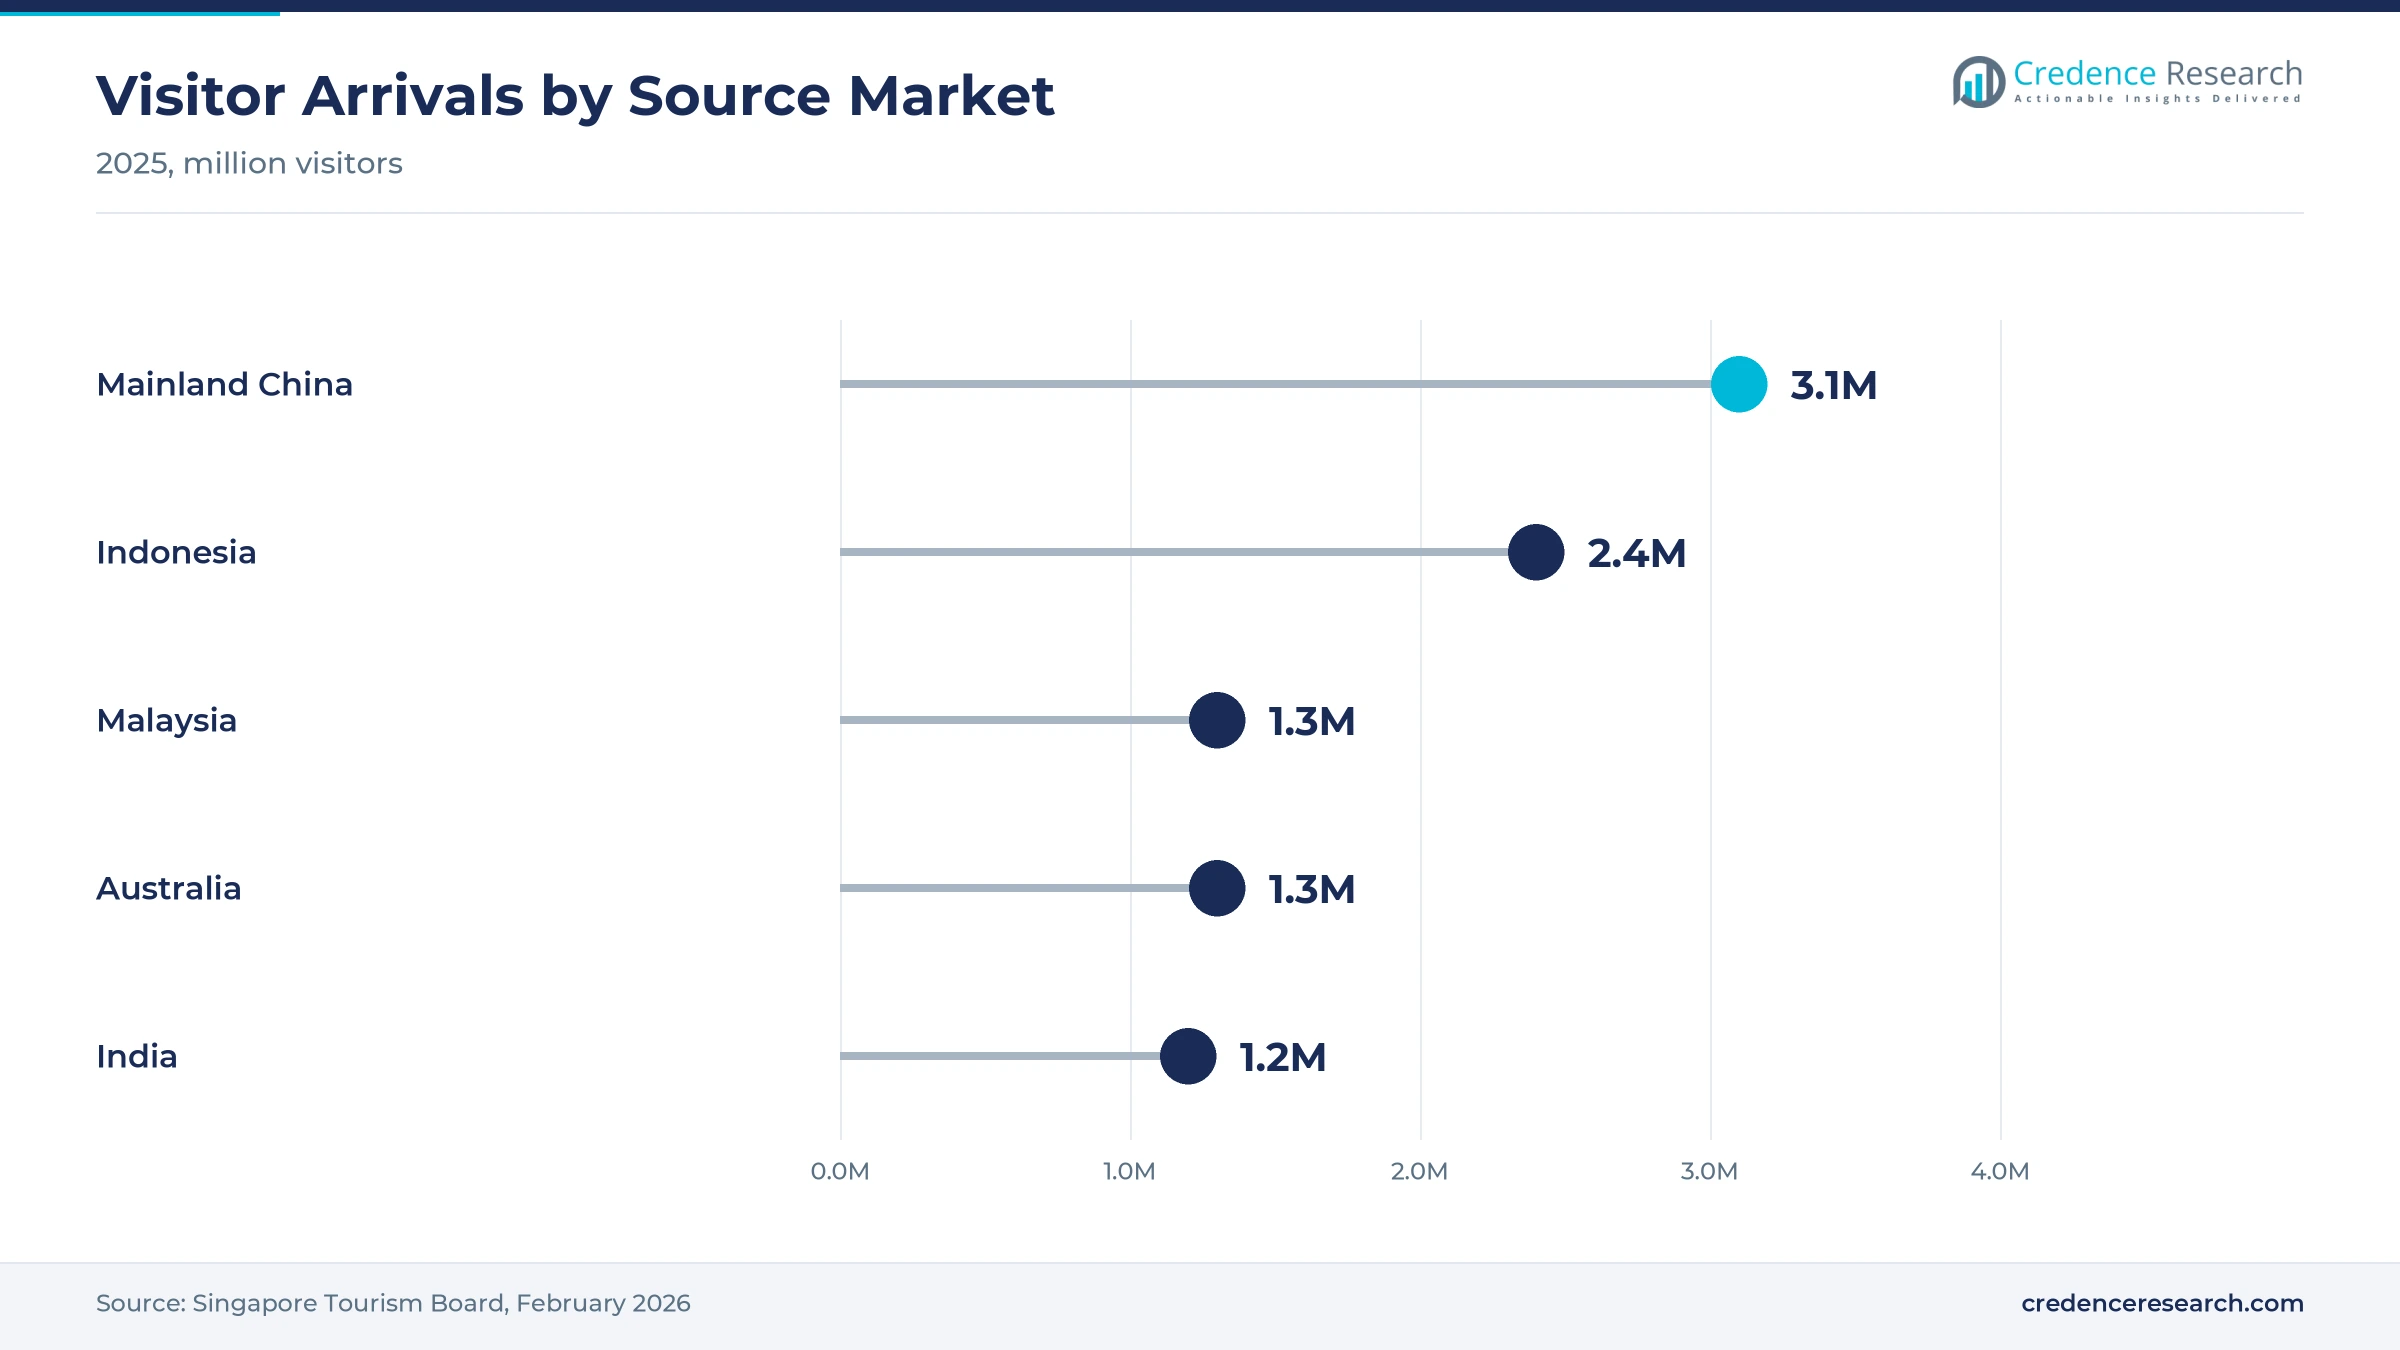
Visitor-led dining expenditure lifts sales, because tourists eat most meals outside their hotels and often choose restaurants, cafes and hawker centers as attractions. Singapore welcomed 16.9 million international visitors in 2025, up 2.3%, according to the Singapore Tourism Board. Tourism receipts reached S$23.9 billion in the first nine months of 2025, up 6.5%, and food and beverage receipts rose 15% over the same period. Food and beverage spending by visitors from mainland China rose 19%, while the Singapore Grand Prix drew 300,641 attendees over three days. As a result, Central and Downtown Singapore grows at 5.17% a year, as visitors crowd Marina Bay and Orchard Road.
Why do frequent resident meals keep demand steady?
High-frequency resident consumption keeps demand steady, because many households eat out several times a week and rely on hawker centers and food courts for daily meals. Singapore had about 6.11 million residents and non-residents in 2025, up from 5.64 million in 2018, according to the World Bank. The same source puts GDP per person at about USD 98,814 in 2025, which supports frequent spending on meals and drinks outside the home. The Urban Redevelopment Authority Master Plan 2025 sets aside up to S$1 billion to build five new hawker centers and upgrade existing ones. In turn, resident households hold 46.0% of 2025 value across all service types.
How do digital ordering and automation raise output?
Digital ordering and process automation raise output per worker, because operators face tight labor supply and need to serve more diners with fewer staff. The share of online sales in total food services sales rose from under 10% in 2019 to 30% in 2021, according to the Ministry of Trade and Industry. The same release said close to 90% of food services small and medium firms used at least one digital solution in 2021. The Productivity Solutions Grant continues to fund ordering, payment and kitchen tools under the Food Services Industry Transformation Map 2025. As a result, direct delivery grows at 6.90% a year, as brands build their own ordering apps.
Why does chain expansion widen choice across the island?
Chain expansion widens choice across the island, because regional groups now open outlets in campuses, new towns and malls instead of only the city center. Jollibee runs 26 outlets in Singapore and opened four in 2025, including sites at the National University of Singapore and Punggol Digital District, according to the Economic Development Board. BreadTalk Group runs more than 700 outlets worldwide and holds Din Tai Fung franchise rights in Singapore, alongside its Food Republic food courts. JUMBO Group prepares dishes for its restaurants in a central kitchen set up in 2008, which keeps quality steady as outlets grow. In turn, mall-based outlets hold 38.0% of 2025 value across the island's outlet formats.
Delivery shake-ups, attraction dining and hawker upgrades
How is the shift in delivery platforms changing operators?
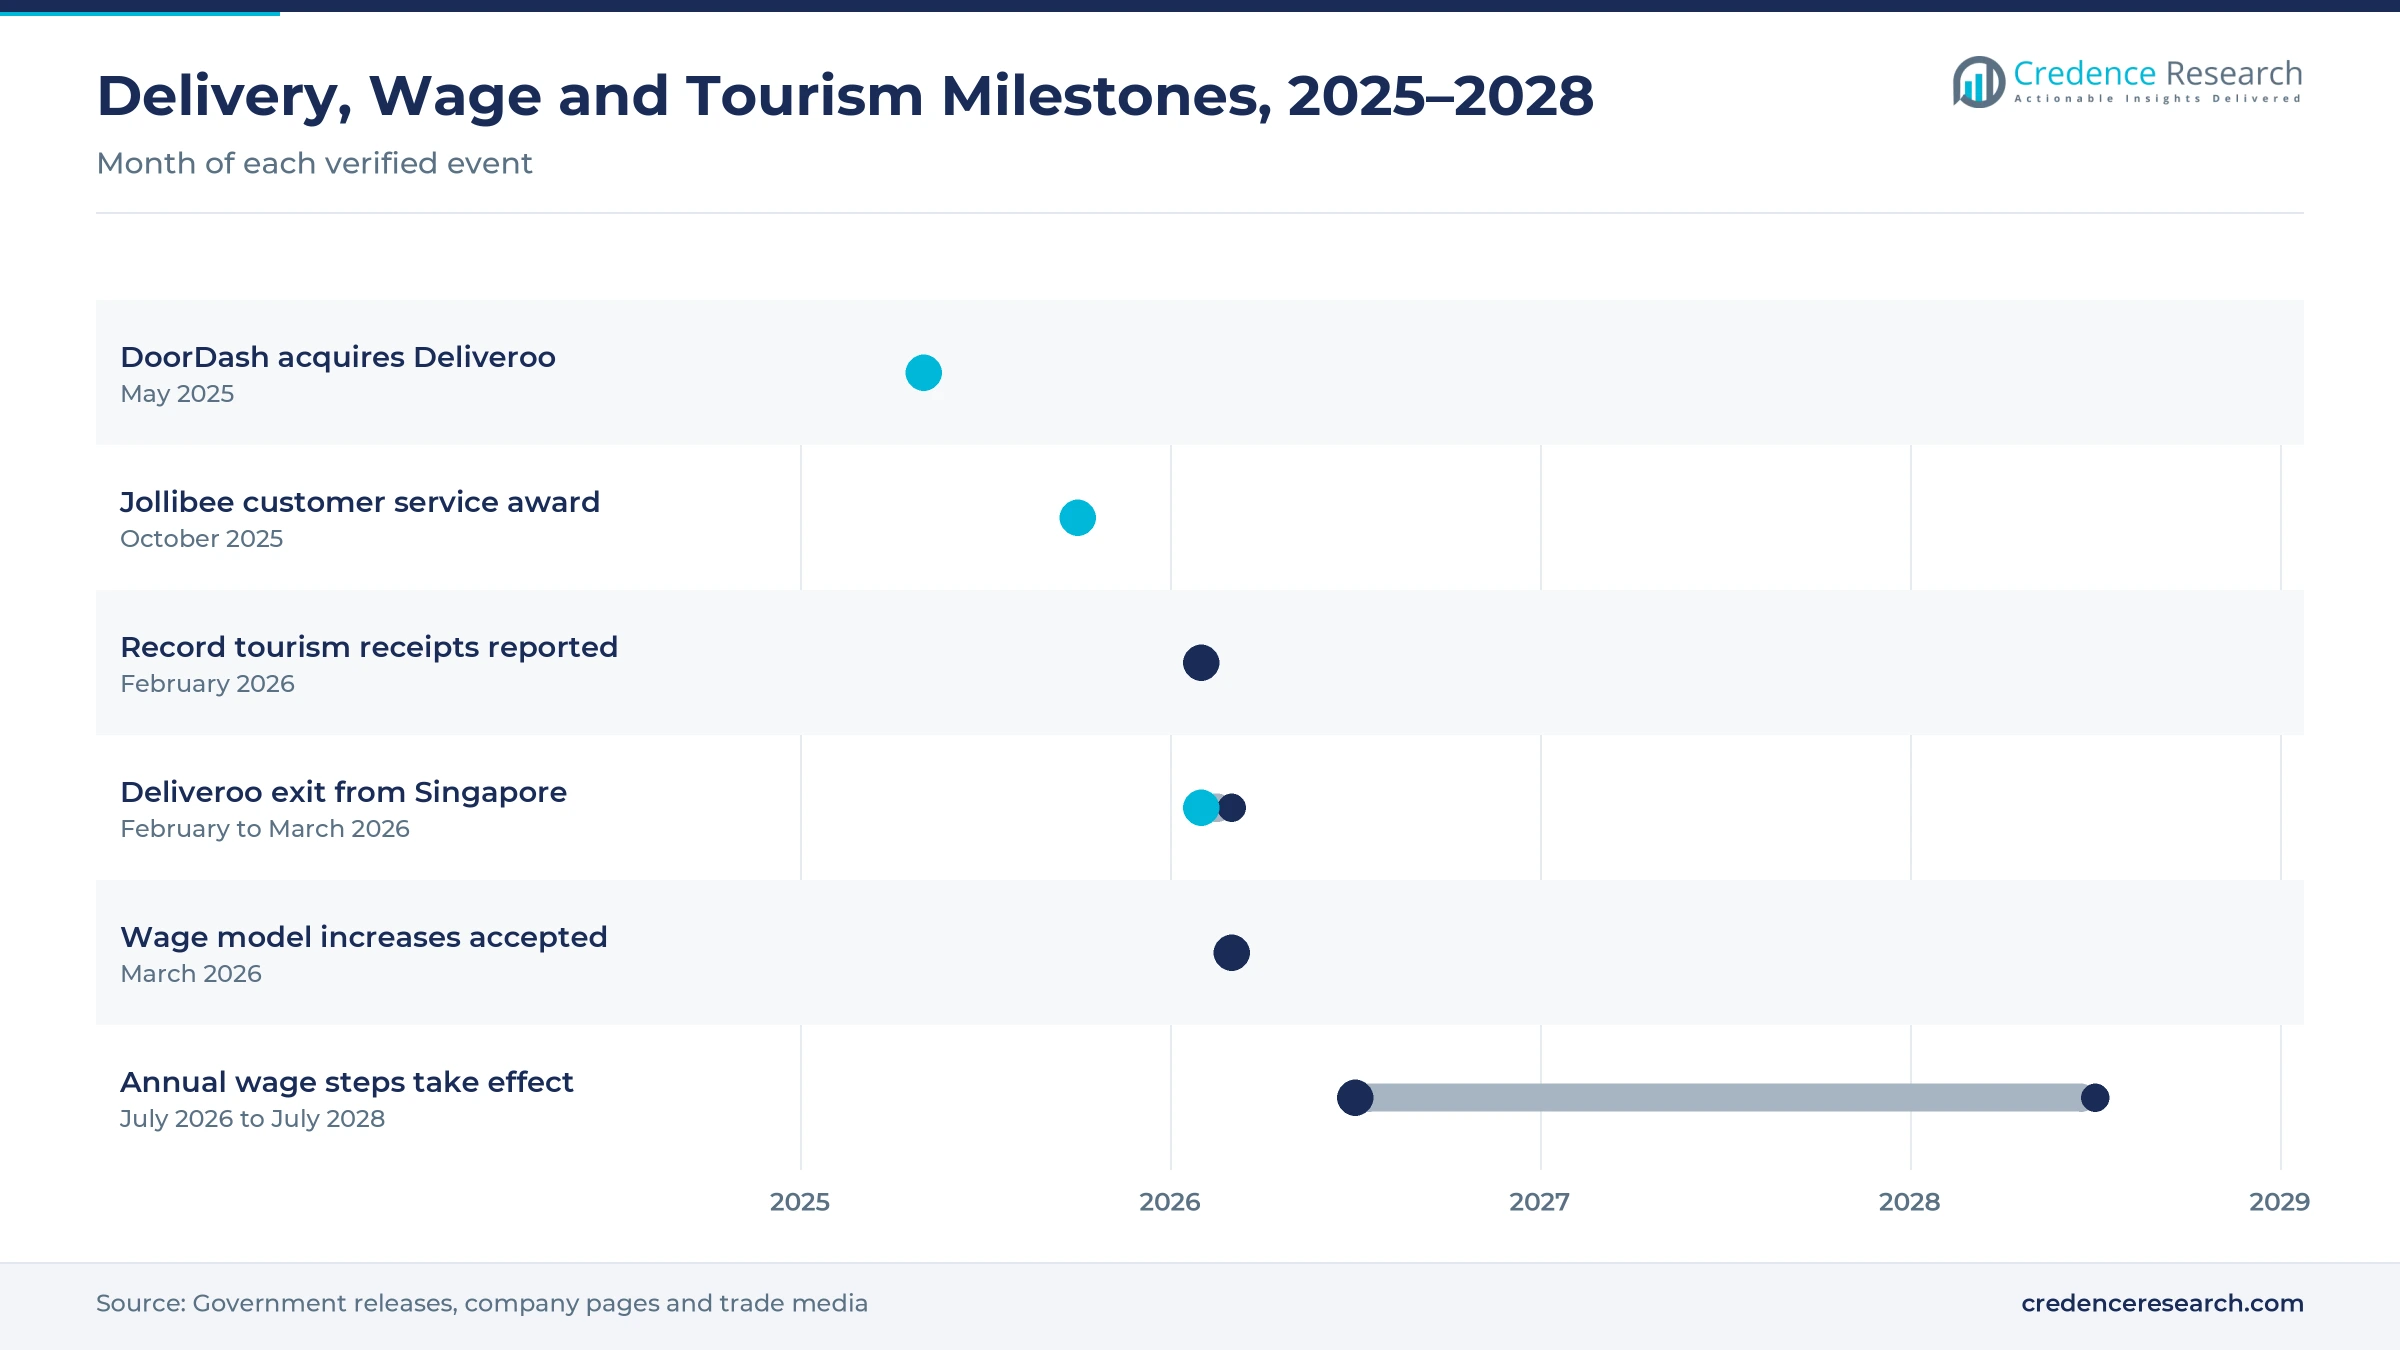
The shift in delivery platforms is changing how operators sell, because fewer large apps now control most third-party delivery orders. DoorDash acquired Deliveroo in May 2025 in a deal valued at USD 3.85 billion, according to Vulcan Post. Deliveroo then announced on Feb. 25, 2026, that it would stop operating in Singapore after March 4, 2026, following a review of its international portfolio. Jollibee cited strong delivery demand as a driver of its Singapore performance in the first half of 2025. As a result, more brands invest in their own apps and in cloud kitchens that serve several delivery menus from one site.
Why is the rise of attraction dining lifting visitor spend?
The rise of attraction dining is lifting visitor spend, because resorts, museums and event venues now pair meals with shows, shopping and sightseeing. Resorts World Sentosa opened Weave, a revamped retail space with more than 40 brands, including Pierre Herme and Korea's Standard Bread, according to the tourism board. New restaurants such as Belimbing and Pop City opened in 2025, while Rempapa moved to the National Gallery Singapore. Concerts by Lady Gaga and Blackpink drew large crowds in 2025, and BTS is set to perform four nights in 2026. In turn, tourists grow at 6.14% a year as a customer group, and the wider hospitality sector gains from longer visits.
Can self-service tools offset rising wage costs?
Self-service tools can offset rising wage costs, because each new wage step raises the cost of every counter and kitchen role. The Government accepted new Food Services Progressive Wage Model increases on March 16, 2026, according to the Ministry of Manpower. The entry wage for food and drink stall assistants rises from $2,080 to $2,220 on July 1, 2026, and to $2,500 by July 1, 2028. The model covers more than 53,000 full-time and part-time workers, and newer Jollibee outlets add self-service kiosks to improve labor efficiency. As a result, demand rises for online ordering systems, kiosks and QR menus.
Is hawker renewal an opening for suburban dining?
Hawker renewal offers an opening for suburban dining, because new and upgraded centers bring affordable meals closer to growing housing estates. The Master Plan 2025 allocates up to S$1 billion to build five new hawker centers and upgrade older ones, while the Hawker Centres Upgrading Programme 2.0 refreshes aging sites. Punggol Digital District, where Jollibee opened an outlet in 2025, adds office workers and students to the North-East. The Singapore Tourism Board expects 17 million to 18 million visitors in 2026, which also lifts suburban attractions. In turn, new towns gain more dining choice, and quick-service restaurant chains follow new residents into suburban malls.
Wage, rent and staffing costs squeeze operator margins
How do rising wages squeeze operator margins?
Rising wages squeeze operator margins, because labor is one of the largest costs in kitchens, counters and dining rooms. Under the Progressive Wage Model, entry wages rise every July from 2026 to 2028, and waiters, cooks and supervisors receive similar steps. As a result, small operators with thin margins must raise menu prices or cut hours. Many respond with self-ordering, central kitchens and smaller menus that need fewer staff per shift.
Why do high rents limit new outlet openings?
High rents limit new outlet openings, because mall and city-center leases cost far more per square meter than suburban shophouses. In turn, independent restaurants struggle to renew leases in prime locations, which pushes some to close or move to cheaper sites. Larger chains negotiate better terms and spread rent across many outlets. Operators respond with smaller footprints, shared kitchens and takeaway counters that earn more from each square meter.
How do staffing shortages slow service quality?
Staffing shortages slow service quality, because the industry employed about 220,300 workers in 2021 and still struggles to fill kitchen and floor roles. As a result, outlets cut opening hours, close on quieter days or serve smaller menus. Training support under the wage model and the industry roadmap helps local workers move into cook and supervisor roles, while automation reduces repetitive tasks in busy outlets.
Why do platform commissions pressure delivery profits?
Platform commissions pressure delivery profits, because third-party apps take a share of every order and charge extra for promotion. In turn, a meal that sells well on an app may earn far less than the same meal served in the outlet. Fewer large platforms also give restaurants less room to negotiate fees. Operators respond with their own apps, pickup discounts and loyalty programs that move regular diners away from commission-based orders.
Central areas lead while the North-East grows fastest
| Region | Value, 2025 (USD billion) | Share, 2025 | CAGR, 2026–2035 |
|---|---|---|---|
| Central and Downtown Singapore | 3.64 | 40.0% | 5.17% |
| West Region | 1.64 | 18.0% | 4.97% |
| East Region | 1.55 | 17.0% | 4.77% |
| North-East Region | 1.36 | 15.0% | 5.47% |
| North Region | 0.91 | 10.0% | 4.57% |
Why does central and Downtown Singapore lead dining value?
Central and Downtown Singapore held a 40.0% share of 2025 value, because the business district, Orchard Road, Marina Bay and Sentosa draw office crowds and tourists every day. Most full-service restaurants, hotel dining rooms and cocktail bars cluster in these areas. The Singapore Grand Prix and major concerts also take place here. As a result, the zone earns the highest spending per diner across all service types.
How does the West region balance industry and new towns?
West Region held an 18.0% share of 2025 value and grows at 4.97% a year, because Jurong, Tuas and the National University of Singapore draw large numbers of workers and students. Jollibee opened an outlet at the university campus in 2025, which shows how chains follow student traffic. Food courts and canteens serve many industrial workers at lunch. In turn, the region leans on limited-service and contract catering formats.
Why does the East region rely on residents and airport traffic?
East Region held a 17.0% share of 2025 value and grows at 4.77% a year, because dense housing estates, Changi Airport and seafood dining along the coast keep demand steady. JUMBO Group traces its roots to the East Coast Seafood Centre, where it began in 1987. Hawker centers in eastern housing estates serve large resident crowds. As a result, the zone combines daily hawker meals with leisure dining.
How is the North-East Region adding the fastest growth?
North-East Region held a 15.0% share of 2025 value and grows fastest at 5.47% a year, because Punggol, Sengkang and Hougang keep adding new homes and offices. Punggol Digital District brings a campus and business park to the area, and Jollibee opened an outlet there in 2025. The chain also planned a further outlet at Hougang Mall in the same zone. In turn, mall-based chains and new hawker centers follow these growing towns.
Why does the North region grow from a smaller base?
North Region held a 10.0% share of 2025 value and grows at 4.57% a year, because Woodlands, Yishun and Sembawang have fewer offices and attractions than other zones. However, residents still eat out often at hawker centers and food courts near train stations. Cross-border travel to Malaysia also shapes daily spending patterns for many households in the zone. As a result, the zone remains a value-focused market built on affordable daily meals.
Delivery, wage and tourism milestones since 2025
| Development | Status and market relevance |
|---|---|
| In May 2025, DoorDash acquired Deliveroo in a deal valued at USD 3.85 billion, bringing its Singapore operations under new ownership. | Reshapes third-party delivery competition |
| In October 2025, Jollibee was named best in customer service among fast-food chains in Singapore in a Straits Times survey. | Supports brand growth after four 2025 openings |
| In February 2026, the Singapore Tourism Board reported record tourism receipts of S$23.9 billion for the first nine months of 2025. | Confirms strong visitor dining spend |
| In February 2026, Deliveroo announced that it would cease operations in Singapore after March 4, 2026. | Narrows the field of delivery platforms |
| In March 2026, the Government accepted new Food Services Progressive Wage Model increases for July 2026 to July 2028. | Raises labor costs and automation demand |
Kiosks, central kitchens and apps modernize kitchens
- Self-service kiosks let diners order and pay without a cashier, which cuts queues and frees staff for food preparation.
- Central kitchens prepare sauces, dough and dishes in bulk for many outlets, which keeps quality steady and reduces skilled kitchen roles.
- Brand ordering apps take orders directly from diners, which cuts platform commissions and builds loyalty data for promotions.
- QR code menus and payments let diners order from the table, which speeds service in busy food courts and cafes.
Need a Custom Version of This Report?
Tailor the scope, geography, or segments to your exact requirements.
- Custom geography or segment scope
- Direct access to our analyst team
Chains, food court operators and groups compete on reach
Competition includes global fast-food chains, regional restaurant groups, food court operators, bakery and cafe brands and thousands of independent hawkers. Jollibee competes through 26 outlets, fast openings on campuses and in new towns, and a portfolio that includes Tim Ho Wan, which it fully acquired in 2024. BreadTalk Group competes with bakeries, Toast Box cafes, Food Republic food courts and Din Tai Fung restaurants. JUMBO Group competes in seafood dining and relies on a central kitchen and research kitchen for new dishes. Rivals compete on location, menu variety, price, delivery reach and loyalty programs. Because wages and rents keep rising, groups with central kitchens, strong brands and their own ordering apps usually defend margins best.
Which groups shape Singapore dining?
| Company | Type | Role in the market |
|---|---|---|
| Jollibee Foods Corporation | Restaurant group | Runs 26 Jollibee outlets and owns Tim Ho Wan |
| BreadTalk Group | Restaurant and food court group | Runs Food Republic and holds Din Tai Fung rights in Singapore |
| JUMBO Group | Restaurant group | Runs seafood restaurants supplied by a central kitchen set up in 2008 |
Credence Research view on dining out in Singapore
Credence Research's view is that Singapore dining will grow steadily rather than quickly, because high incomes, frequent eating out and strong tourism support demand while wages and rents limit margins. Full-service restaurants remain the largest value pool, while cafes, tourist dining, direct delivery and cloud kitchens add the fastest growth. New hawker centers and suburban towns will spread demand beyond the city center. Operators with central kitchens, own ordering apps and strong brands should gain the most, while small independents face the heaviest cost pressure.
How the national dining estimate was built
The report uses 2025 as the base year on a calendar basis, and market values come from the Credence Research model. That model combines tourism statistics, World Bank population and income data, wage model schedules, government industry plans and company releases. The five zones, their shares and all segment splits and growth rates are Credence Research estimates. Sources used are official statistics, government releases, company pages and trade media, and no interviews or surveys were used.
Visitors and digital ordering carry growth to 2035
The Singapore foodservice market is expected to reach USD 14.85 billion by 2035, a 5.05% CAGR during 2026–2035, as visitors, residents and office workers keep eating out and operators adopt digital tools. Growth should be strongest in cafes, tourist dining, direct delivery, cloud kitchens and the North-East Region, because these areas gain most from new towns, apps and attractions. New hawker centers will keep daily meals affordable, while wage steps, high rents and staffing gaps could slow smaller operators.
Frequently Asked Questions
How big is the Singapore foodservice market?
Which service type leads Singapore dining value?
Which zone leads the Singapore market?
How does tourism support dining sales in Singapore?
How will the Progressive Wage Model affect operators?
What changed in Singapore food delivery recently?
Who are the leading companies in the Singapore market?
What are the main challenges for dining operators in Singapore?
Table of Content
Chapter 1 Market Segmentation
- 1.1 Segmentation Framework
- 1.1.1 Product and Service Classification
- 1.1.2 Application and End-Use Classification
- 1.1.3 Technology and Solution Classification
- 1.1.4 Customer and Distribution Channel Classification
- 1.1.5 Geographic Segmentation
- 1.1.6 Market Segment Definitions and Boundaries
- 1.2 By Service Type
- 1.2.1 Full-Service Restaurants
- 1.2.2 Limited-Service Restaurants
- 1.2.3 Cafes and Beverage Outlets
- 1.2.4 Food Courts and Hawker Services
- 1.2.5 Catering Services
- 1.3 By Customer Type
- 1.3.1 Resident Households
- 1.3.2 Office Workers
- 1.3.3 Students
- 1.3.4 Tourists
- 1.3.5 Institutional Buyers
- 1.4 By Delivery Model
- 1.4.1 Dine-In
- 1.4.2 Takeaway
- 1.4.3 Platform Delivery
- 1.4.4 Direct Delivery
- 1.4.5 Contract and On-Site Service
- 1.5 By Outlet Format
- 1.5.1 Standalone Outlets
- 1.5.2 Mall-Based Outlets
- 1.5.3 Hawker and Food Court Stalls
- 1.5.4 Hotel and Attraction Venues
- 1.5.5 Cloud Kitchens
Chapter 2 Introduction
- 2.1 Report Objectives and Scope
- 2.2 Product Definition and Industry Terminology
- 2.3 Market Inclusions and Exclusions
- 2.4 Research Process
- 2.4.1 Primary Research and Expert Interviews
- 2.4.2 Secondary Research and Source Review
- 2.4.3 Top-Down and Bottom-Up Estimation
- 2.4.4 Data Triangulation and Verification
- 2.5 Market Size Measurement Basis
- 2.5.1 2025: USD 9.09 billion → 2035: USD 14.85 billion
- 2.6 Historical and Forecast Reference Periods
- 2.6.1 Historical Period: 2018-2025
- 2.6.2 Base Year: 2025
- 2.6.3 Forecast Period: 2025-2035
- 2.7 Research Assumptions and Limitations
Chapter 3 Executive Summary
- 3.1 Market Snapshot and Key Findings
- 3.2 Base-Year Market Size, 2025
- 3.3 Forecast Market Size, 2035
- 3.4 Revenue and Volume Growth Outlook
- 3.5 Key Demand and Supply Indicators
- 3.6 Leading Market Segments
- 3.7 Fastest-Growing Market Opportunities
- 3.8 Regional Performance Highlights
- 3.9 Technology and Industry Transformation
- 3.10 Competitive Landscape Summary
- 3.11 Analyst View and Strategic Implications
Chapter 4 Singapore Foodservice Market Trends and Developments
- 4.1 Historical Industry Development, 2018-2025
- 4.2 Recent Market Trends and Developments
- 4.3 Demand and Customer Behavior Trends
- 4.4 Technology and Product Innovation
- 4.5 Artificial Intelligence, Automation and Digitalization
- 4.6 Local Manufacturing and Supply Chain Realignment
- 4.7 Industry Partnerships, Mergers and Acquisitions
- 4.8 Sustainability and Circular Economy Developments
- 4.9 Government and Private Sector Investment Trends
- 4.10 Emerging Business Models and Commercialization
- 4.11 Industry Developments and Announcements
Chapter 5 Singapore Foodservice Market Production, Supply and Demand Analysis
- 5.1 Demand Trend and Consumption Analysis, 2018-2025
- 5.2 Demand Forecast, 2025-2035
- 5.3 Production and Output Trend, 2018-2025
- 5.4 Production and Output Forecast, 2025-2035
- 5.5 Installed Capacity and Capacity Utilization
- 5.6 Company-Wise Production Plants and Statistics
- 5.6.1 Installed Production Capacity
- 5.6.2 Actual Production
- 5.6.3 Planned Capacity and Expansion Targets
- 5.7 Supply Chain Structure and Procurement Trends
- 5.8 Supply-Demand Gap and Bottlenecks
- 5.9 Import Dependence and Sourcing Structure
- 5.10 Contract Manufacturing and Outsourcing
- 5.11 Regional Supply and Demand Concentration
Chapter 6 Singapore Foodservice Market Pricing Analysis
- 6.1 Pricing Structure and Measurement
- 6.2 Historical Pricing Trends, 2018-2025
- 6.3 Pricing Outlook, 2025-2035
- 6.4 Average Selling Price and Unit Economics
- 6.5 Pricing by Product and Market Segment
- 6.6 Geographic Pricing Differences
- 6.7 Key Input, Energy, Labor and Logistics Costs
- 6.8 Contract Pricing and Purchasing Models
- 6.9 Pricing Sensitivity and Competitive Positioning
- 6.10 Price, Margin and Profitability Implications
Chapter 7 Singapore Foodservice Market Dynamics
- 7.1 Market Growth Drivers
- 7.1.1 Demand-Side Drivers
- 7.1.2 Technology and Innovation Drivers
- 7.1.3 Infrastructure and Investment Drivers
- 7.1.4 Regulatory and Policy Drivers
- 7.2 Market Restraints
- 7.2.1 Cost and Affordability Constraints
- 7.2.2 Technology and Adoption Barriers
- 7.2.3 Supply Chain and Operational Constraints
- 7.3 Market Challenges
- 7.3.1 Competitive Pressure and Margin Erosion
- 7.3.2 Skills, Infrastructure and Implementation Gaps
- 7.4 Emerging Market Opportunities
- 7.5 Market Dynamics Impact and Time-Horizon Assessment
Chapter 8 Singapore Foodservice Value Chain Analysis
- 8.1 Industry Value Chain Overview
- 8.2 Upstream Suppliers and Critical Inputs
- 8.3 Technology and Component Providers
- 8.4 Manufacturing or Service Delivery
- 8.5 Distribution, Channel Partners and Integrators
- 8.6 Downstream Applications and End Users
- 8.7 Value Addition and Profit Pools
- 8.8 Vertical Integration and Outsourcing
- 8.9 Supplier Concentration and Risk
- 8.10 Supply Chain Localization and Resilience
Chapter 9 Singapore Foodservice Market Regulations and Policies
- 9.1 Relevant Laws, Standards and Compliance Frameworks
- 9.2 Product, Service, Safety and Quality Requirements
- 9.3 Government Policies, Incentives and Subsidies
- 9.4 Imports, Exports and Trade Barriers
- 9.5 Public Procurement and Local Content Requirements
- 9.6 Environmental and Sustainability Compliance
- 9.7 Upcoming Policy Changes and Market Implications
Chapter 10 Singapore Foodservice Market Hotspots and Opportunities
- 10.1 Market Opportunity Mapping and Growth Hotspots
- 10.2 High-Growth Applications and Customer Groups
- 10.3 Underserved Markets and White-Space Opportunities
- 10.4 Emerging Technology and Product Opportunities
- 10.5 New Capacity and Investment Hotspots
- 10.6 Market Entry and Expansion Opportunities
- 10.7 Distribution and Partnership Opportunities
- 10.8 Near-Term and Long-Term Commercial Potential
- 10.9 Opportunity Attractiveness and Execution Risks
Chapter 11 Singapore Foodservice Market Outlook, 2025-2035
- 11.1 Market Size and Analysis
- 11.1.1 Revenue (Market Measurement: 2025: USD 9.09 billion → 2035: USD 14.85 billion)
- 11.1.2 Market Volume and Quantity Sold
- 11.1.3 Historical Market Size, 2018-2025
- 11.1.4 Base-Year Market Size, 2025
- 11.2 Market Forecast, 2025-2035
- 11.2.1 Revenue Forecast to 2035
- 11.2.2 Volume Forecast to 2035
- 11.2.3 CAGR and Year-on-Year Growth
- 11.2.4 Incremental Revenue Opportunity
- 11.3 Forecast Assumptions and Scenario Analysis
- 11.3.1 Base-Case Forecast
- 11.3.2 Optimistic and Conservative Scenarios
- 11.3.3 Technology, Pricing and Policy Sensitivities
- 11.4 Market Attractiveness and Growth Outlook
Chapter 12 Singapore Foodservice Market Segmentation and Outlook
- 12.1 Segmentation Summary and Market Shares, 2025
- 12.2 Largest and Fastest-Growing Segments
- 12.3 By Service Type - Market Size and Forecast, 2025-2035
- 12.3.1 Segment Definition and Scope
- 12.3.2 Historical Market Size, 2018-2025
- 12.3.3 Revenue Forecast, 2025-2035
- 12.3.4 Volume Forecast, 2025-2035
- 12.3.5 Base-Year Market Share, 2025
- 12.3.6 Segment CAGR and Growth Drivers
- 12.3.7 Subsegment Market Size and Forecast
- 12.3.7.1 Full-Service Restaurants
- 12.3.7.2 Limited-Service Restaurants
- 12.3.7.3 Cafes and Beverage Outlets
- 12.3.7.4 Food Courts and Hawker Services
- 12.3.7.5 Catering Services
- 12.3.8 Subsegment Pricing and Adoption Trends
- 12.3.9 Leading Suppliers and Competition
- 12.3.10 Regional Demand and Opportunities
- 12.4 By Customer Type - Market Size and Forecast, 2025-2035
- 12.4.1 Segment Definition and Scope
- 12.4.2 Historical Market Size, 2018-2025
- 12.4.3 Revenue Forecast, 2025-2035
- 12.4.4 Volume Forecast, 2025-2035
- 12.4.5 Base-Year Market Share, 2025
- 12.4.6 Segment CAGR and Growth Drivers
- 12.4.7 Subsegment Market Size and Forecast
- 12.4.7.1 Resident Households
- 12.4.7.2 Office Workers
- 12.4.7.3 Students
- 12.4.7.4 Tourists
- 12.4.7.5 Institutional Buyers
- 12.4.8 Subsegment Pricing and Adoption Trends
- 12.4.9 Leading Suppliers and Competition
- 12.4.10 Regional Demand and Opportunities
- 12.5 By Delivery Model - Market Size and Forecast, 2025-2035
- 12.5.1 Segment Definition and Scope
- 12.5.2 Historical Market Size, 2018-2025
- 12.5.3 Revenue Forecast, 2025-2035
- 12.5.4 Volume Forecast, 2025-2035
- 12.5.5 Base-Year Market Share, 2025
- 12.5.6 Segment CAGR and Growth Drivers
- 12.5.7 Subsegment Market Size and Forecast
- 12.5.7.1 Dine-In
- 12.5.7.2 Takeaway
- 12.5.7.3 Platform Delivery
- 12.5.7.4 Direct Delivery
- 12.5.7.5 Contract and On-Site Service
- 12.5.8 Subsegment Pricing and Adoption Trends
- 12.5.9 Leading Suppliers and Competition
- 12.5.10 Regional Demand and Opportunities
- 12.6 By Outlet Format - Market Size and Forecast, 2025-2035
- 12.6.1 Segment Definition and Scope
- 12.6.2 Historical Market Size, 2018-2025
- 12.6.3 Revenue Forecast, 2025-2035
- 12.6.4 Volume Forecast, 2025-2035
- 12.6.5 Base-Year Market Share, 2025
- 12.6.6 Segment CAGR and Growth Drivers
- 12.6.7 Subsegment Market Size and Forecast
- 12.6.7.1 Standalone Outlets
- 12.6.7.2 Mall-Based Outlets
- 12.6.7.3 Hawker and Food Court Stalls
- 12.6.7.4 Hotel and Attraction Venues
- 12.6.7.5 Cloud Kitchens
- 12.6.8 Subsegment Pricing and Adoption Trends
- 12.6.9 Leading Suppliers and Competition
- 12.6.10 Regional Demand and Opportunities
- 12.7 Segment Growth Comparison
- 12.8 Segment Attractiveness and Priority Matrix
Chapter 13 Singapore Foodservice End-Use and Application Market Outlook
- 13.1 End-Use Industry and Customer Demand Structure
- 13.2 Leading Applications and Customer Groups
- 13.3 End-Use Market Size, Share and Forecast
- 13.4 Major End-Use Industry Deep Dives
- 13.4.1 Customer Requirements and Use Cases
- 13.4.2 Demand and Replacement Cycles
- 13.4.3 Technical and Regulatory Considerations
- 13.4.4 Purchasing and Procurement Models
- 13.4.5 Leading Vendors and Distribution Channels
- 13.4.6 Forecast and Commercial Opportunities
- 13.5 Emerging Applications and Cross-Segment Demand
- 13.6 End-Use Industry Investment Priorities
Chapter 14 Singapore Foodservice Geographic Market Outlook, 2025-2035
- 14.1 Domestic Market Distribution and Demand Clusters
- 14.2 State- or Province-Wise Market Size and Forecast, 2025-2035
- 14.3 City and Metropolitan Market Outlook
- 14.4 Industrial, Manufacturing and Commercial Clusters
- 14.5 Geographic Concentration of Key End Users
- 14.6 Local Pricing and Purchasing Differences
- 14.7 Domestic Production Facilities and Capacity Map
- 14.8 Local Infrastructure and Project Pipeline
- 14.9 State-Level Policy and Incentive Differences
- 14.10 Subnational Investment Hotspots and Opportunities
- 14.11 Distribution and Logistics Networks
- 14.12 Domestic Competitive Footprint
Chapter 15 Singapore Foodservice Technology, Innovation and Sustainability Outlook
- 15.1 Technology Landscape and Maturity
- 15.2 Product, Process and Service Innovation
- 15.3 AI, Automation and Digital Tools in the Industry
- 15.4 Technology Adoption and Performance Benchmarking
- 15.5 Innovation Pipeline and R&D Investment
- 15.6 Patent and Intellectual Property Trends
- 15.7 Energy Efficiency and Resource Management
- 15.8 Sustainability, Recycling and Circularity
- 15.9 Technology Roadmap, 2025-2035
- 15.10 Risks of Obsolescence and Technology Substitution
Chapter 16 Singapore Foodservice Market Key Strategic Imperatives
- 16.1 Growth and Market Entry Priorities
- 16.2 High-Return Products and Segments
- 16.3 Pricing, Profitability and Cost Optimization
- 16.4 Technology Investment and Product Differentiation
- 16.5 Supply Chain Localization and Resilience
- 16.6 Distribution and Customer Acquisition
- 16.7 Partnership, Acquisition and Capacity Strategy
- 16.8 Regional Expansion Priorities
- 16.9 Short-, Medium- and Long-Term Actions
Chapter 17 Competition Outlook
- 17.1 Industry Competition Characteristics
- 17.2 Market Structure and Concentration
- 17.3 Market Share and Competitive Positioning, 2025
- 17.4 Company-Wise Revenue and Product Benchmarking
- 17.5 Production and Service Capacity Benchmarking
- 17.6 Technology, Pricing and Differentiation
- 17.7 Regional Footprint and Distribution Strength
- 17.8 Mergers, Acquisitions and Strategic Alliances
- 17.9 New Entrants and Competitive Threats
- 17.10 Porter's Five Forces and Industry Attractiveness
- 17.11 Competitive Outlook, 2025-2035
Chapter 18 Company Profiles
- 18.1 Company Coverage and Selection Criteria
- 18.2 McDonald's Singapore
- 18.2.1 Business Description
- 18.2.2 Company Ownership and Geographic Presence
- 18.2.3 Product and Service Portfolio
- 18.2.4 Manufacturing and Operating Footprint
- 18.2.5 Production Capacity and Expansion Plans
- 18.2.6 Financial Performance and Investment
- 18.2.7 Market Share and Competitive Position
- 18.2.8 Technology and Innovation Capabilities
- 18.2.9 Strategic Alliances or Partnerships
- 18.2.10 Recent Developments
- 18.2.11 Growth Strategy and Outlook
- 18.3 Starbucks Singapore
- 18.4 KFC Singapore
- 18.5 Jollibee Foods Corporation
- 18.6 BreadTalk Group
- 18.7 Koufu Group
- 18.8 JUMBO Group
- 18.9 RE&S Holdings
- 18.10 Minor Food Singapore
- 18.11 Sushi Express Group
- 18.12 Other Relevant Market Participants
Note: Every listed company is profiled on the structure shown under the first company. The company list is preliminary and may change based on research findings, market developments, data availability and client requirements.
Chapter 19 Disclaimer
- 19.1 Research and Forecast Disclaimer
- 19.2 Data Source and Estimation Limitations
Note: The depth of individual sections depends on data availability for this market. Volume, capacity, trade and other unit-based metrics are included where applicable.